

What is Climate Smart Forestry?
By Peter Kolb, PhD — MSU Extension Forestry Specialist
Terms such as global warming, anthropogenic warming, climate change, etc. have been found within various scientific and public media for about the past 30 years. What started as science driven research about human impacts on the Earth’s atmosphere and climate has also become a social and political controversy that is not likely to end any time in the near future. Regardless of perspective, this topic will continue to affect our daily lives by influencing the development of energy sources, commodity products from lightbulbs to automobiles, home construction, and how we manage our land, including urban heat sinks, agricultural crop and livestock production, and forested landscapes. Though the science behind this topic is incredibly complex with multiple interacting factors, the impacts of human-activity-produced gases such as carbon dioxide (CO2) and methane on atmospheric energy exchange (primarily Troposphere temperatures seen in Diagram 1) has been accepted by the mainstream academic world as having strong potential influences on all ecosystems across the Earth.
LAYERS OF THE ATMOSPHERE
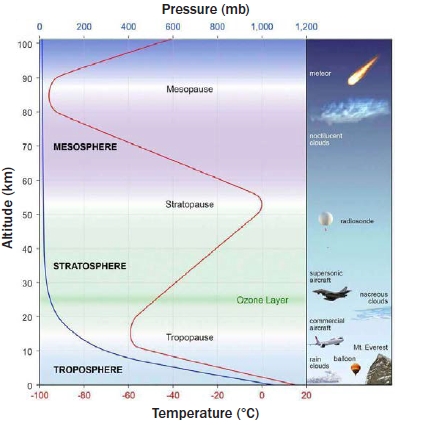
Diagram 1. Earth’s atmospheric layers
Source: phys.org/news/2014-05-earth-magnetic-field-important-climate.html
Climate changes
Measured and modeled climate changes typically refer to temperatures and air circulation within the Troposphere (Diagram 2). It is the atmospheric layer closest to Earth’s surface and the densest of the five atmospheric layers surrounding the Earth. At sea level the air pressure is 14.5 lbs/square inch, 1000 millibars or 1 Atmosphere. For comparison, the top of Mount Everest protrudes a little more than half the thickness of the troposphere at 8.8 kilometers elevation and has an air pressure of about 3.4 lbs/square inch. This altitude is at the upper limit of where enough oxygen exists to support most life and is why the upper mountain top is referred to as the “death zone” by climbers. The Troposphere is thickest at the Equator at approximately 15 kilometers, and thinnest at the poles at slightly more than 5 km. Its role in determining weather and climate comes from the fact that energy absorption from the sun (heat) is greatest at the equator, which then dissipates toward the north and south poles where solar energy absorption is lowest. Over millennia this has resulted in mostly predictable Troposphere air circulation patterns with prevailing wind and moisture patterns. Known centuries ago to sailors as trade winds, these patterns have been modeled into what are known as general circulation models and are used to predict both annual weather and potentially longer-term (30-plus-year) climate trends. To visualize how higher energy-absorbing CO2 might affect atmospheric temperatures, a model of carbon dioxide concentrations and circulation can be viewed within this website, science.nasa.gov/earth/watch-carbon-dioxide-move-through-earths-atmosphere/.
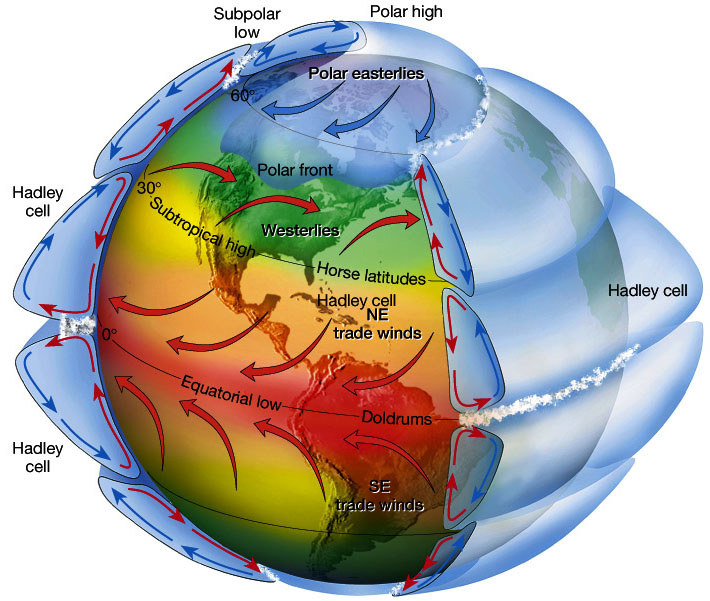
Diagram 2. General Troposphere air circulation
Source: wirecourtenia5nm.z14.web.core.windows.net/convection-cell-diagram.html
Forests factor into the climate change discussion in several ways. First, forests are considered one of the largest organic carbon sinks across the Earth, surpassed only by oceans. How forests store carbon and their potential to influence atmospheric CO2 is quite complex (discussed later in this article). Second, and equally important, is how the future function and resilience of forests is impacted by changes in climate. The Earth’s atmosphere could be visualized as a pot of water on a stove top. When the heat is turned up, the temperature increases at the bottom of the pot and water circulates from the heat source to cooler areas within the pot. This is similar to how the Earth’s atmosphere reacts to the sun’s heating effect at the equator (Diagram 2). As more heat is applied to the stove top (sun), circulation from the hot bottom of the pot to the cooler top increases in speed and magnitude. Simplistically this can be seen as a model for how the sun’s energy is absorbed by the Earth’s atmosphere by disparate concentrations of water vapor (a greenhouse gas that is 0.4 to 4 percent of the Troposphere depending on location) and CO2 (a greenhouse gas that is on average 0.04 percent of the Troposphere). Differences in energy absorption and retention within the lower layers of the Earth’s atmosphere drive airmass mixing, also known as weather systems and storm fronts. As more energy is absorbed, airmass mixing can increase in magnitude, resulting in more severe storms and less predictable weather. Increases in hurricane frequency and magnitudes emanating from equatorial regions toward the end of summer is one observable example given to be the result of increases in atmospheric energy absorption.
GEOLOGICAL TIMESCALE:
Concentrations of CO2 and temperature fluctuations
Million Years Before Present
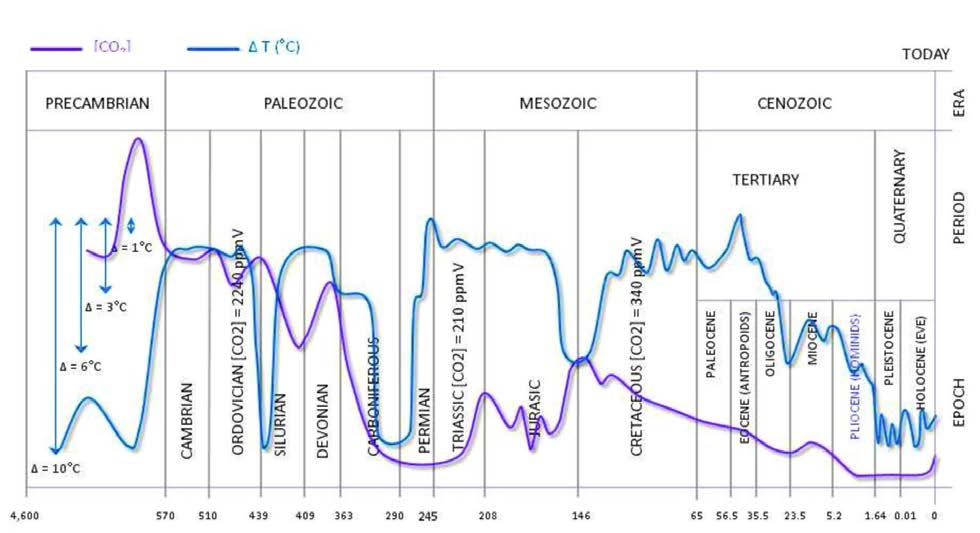
Diagram 3. Climate changes over the past 57 million years. The past 10,000 years of more moderate climate fluctuations are on the far right denoted as the Holocene.
Source: 1 – Analysis of the Temperature Oscillations in Geological Eras by Dr. C. R. Scotese © 2002. 2 – Ruddiman, W. F. 2001. Earth’s Climate: past and future. W. H. Freeman & Sons. New York, NY. 3 – Mark Pagani et al. Marked Decline in Atmospheric Carbon Dioxide Concentrations During the Paleocene. Science; Vol. 309, No. 5734; pp. 600-603. 22 July 2005. Corrected on 07 July 2008 (CO2: Ordovician Period).
Climate impacts on forests
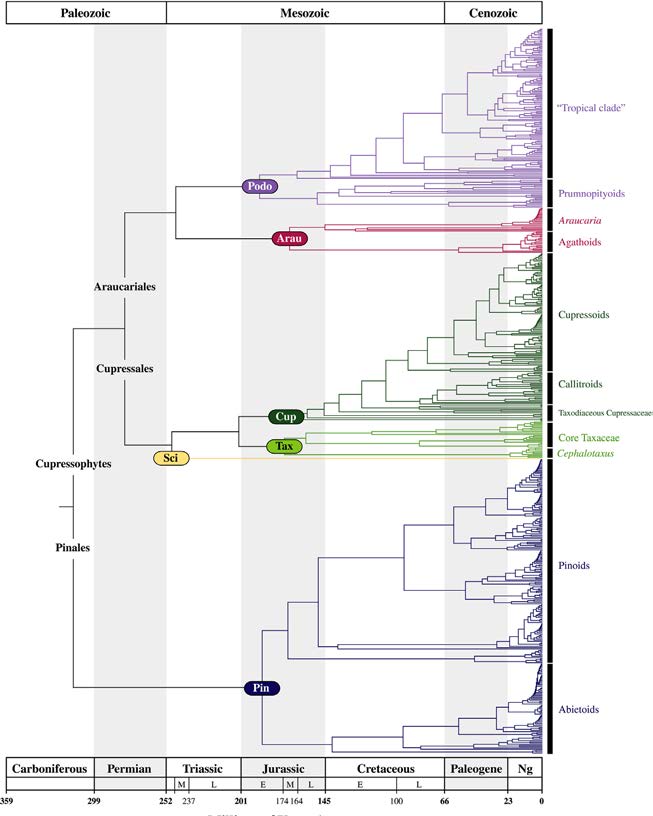
The major climate influences that affect different tree species’ survival and growth are wind speeds, relative humidity, annual temperature cycles, and the magnitude and timing of annual precipitation. Over the past 300 million years, fossil records show that the first modern gymnosperms (such as ginkgo, spruce and pine species) appeared about 200 million years ago. Angiosperms (broadleaf deciduous trees) developed about 125 million years ago, with fossil records for maples found 67 million and oaks 56 million years ago. When a graph of Earth’s major climate changes (Diagram 3) is compared to the development of tree species (Diagram 4) over the same time frame, a correlation between major climate changes and the appearance of new tree species becomes evident. The causes of the Earth’s major climate shifts are theoretically attributed to the wobble of the Earth on its axis, which changes the consistency of solar energy absorption. There are, however, many other suggested influences, including shifts in cosmic radiation that affect the percentage of cloud cover across the Earth, meteor impacts, volcanic events, magnetic shifts, and feedback loops between life forms and their contribution to changes in atmospheric gases. Which of these are currently primary contributors to a warming climate remain an area of major study and controversy.
Millions of Years Ago
Diagram 4. Evolution of tree species over time with the first conifer species developing some
250 million years ago and periodically splitting into additional different species.
About 20 million years ago a significant drop in Cenozoic temperature resulted in
regional climate disruptions that selected for mutations that created many unique,
new but related, species.
Source: Leslie A., Beaulieu J., Holman G., Campbell C.S., Wenbin M., Raubeson L.R., and Mathews S. 2018. An overview of extant conifer evolution from the perspective of the fossil record. American Journal of Botany. Pgs 1-14 Doi:10.1002/ajb2.1143
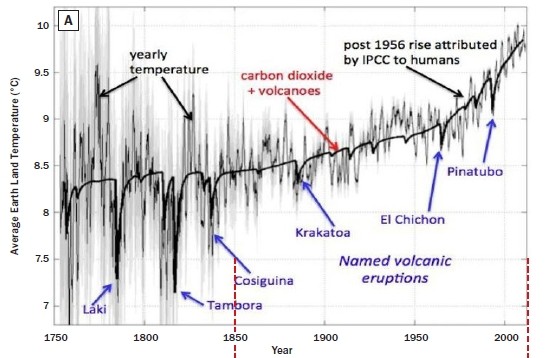
Each era and period of the Earth’s history is in part characterized by major shifts and fluctuations in climate, as well as changes in populations of varying life forms, including the evolution (creation-adaptation) of new tree species. Within each progressively shorter delineation of the Earth’s history, such as splitting periods into epochs, climatic fluctuations are proportionally lesser in magnitude and these time frames might be characterized as being more climatically stable. When the last 13,000 years of Earth’s history, known as the Holocene epoch, is examined, major climatic shifts still occurred, though at a lesser scale than across the entire longer 1.44 million years of the Quaternary Period. Similarly, within shorter time spans of the Holocene (Diagram 5), such as the past 4,000 years during which different human civilizations developed and collapsed multiple times, or even the past 250 years (Diagram 6A), climate fluctuations that affected rainfall, temperatures, and thereby plant and animal distributions were not uncommon.
CLIMATE: DATA FROM GREENLAND ICE CORES (GISP2)
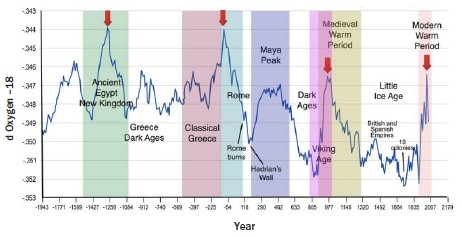 Diagram 5. Reconstruction of the past 4,000 years of global climate average and development of
human civilizations.
Diagram 5. Reconstruction of the past 4,000 years of global climate average and development of
human civilizations.
Source: NOAA/NGDC Paleoclimatology Program
Major weather and climate events experienced and recorded in human history include the medieval warm period from 950 to about 1250AD, followed by the Maunder Minimum between 1645 and 1715, when low solar output created an extreme cold period that is suggested to have prolonged the little-ice age until the late 1800s. Volcanic events such as the eruption of 1815 Tambora in Indonesia resulted in the 1816 “summer that never was.” The eruption created a massive volcanic ash cloud that reflected solar radiation, cooled the Earth, and resulted in massive crop failures, starvation and extensive human misery. These past events affected forests by impacting tree growth and survival, seedling regeneration, pest and pathogen outbreaks, and influenced the distributions of species that we currently see across landscapes and often assumed have been there in perpetuity. Most recently in 2021, the South Pacific Hunga-Tonga submarine volcano erupted with such force that it spewed water vapor as high as the Stratosphere, increasing the total stratospheric water vapor content by an estimated 10 percent. Four years later, that water concentration is estimated to still remain in the Stratosphere. Its impacts are at this point still uncertain, though changes in Troposphere air temperature have been correlated to this event.
Identification of what we currently consider normal drivers of multi-year weather phenomena such as “El Nino/La Nina” and “Pacific Decadal Oscillation” have profound temperature and moisture impacts that can promote expansive tree mortality events or alternatively, tree regeneration events. Such climate/weather fluctuations have also proven important predictors for past and future severe wildfire seasons and insect and disease outbreaks, as well as agricultural crop production and human energy needs (Diagram 6B). Prolonged warm-dry trends in weather and climate correlate well with occurrences of severe wildfire seasons such as the 1910 Big Burn along the Idaho/Montana border, the Dustbowl period of the 1920s, the Tillamook burn in 1933, and more recently, increases of severe wildfire seasons starting with the Yellowstone fires of 1988. Quite the opposite is the 40-year cool-wet period from the mid-1940s until mid-1980s, where increased summer moisture allowed increases in tree growth and seedling regeneration, as well as fewer and less expansive wildfires that were easier to control by the newly formed Forest Service than the fires following the warming trend of the 1980s. Thus, forests of the Northern Rockies have historically gone through cycles of great growth and expansion interspersed by periods of significant tree mortality that correlate well with weather cycles. The shorter the weather cycles, the lesser the impact on forest growth, density and mortality. The longer the weather cycles, the greater the impacts on forests.
BERKELEY EARTH RESULTS
PACIFIC DECADAL OSCILLATION (PDO)
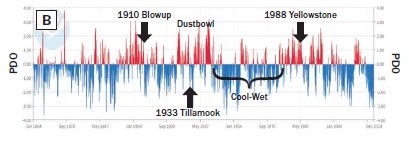
Diagram 6A. Estimated global land temperature fluctuations over the
past 250 years.
Source: BerkeleyEarth.org
Diagram 6B. Pacific Decadal Oscillation temperature and precipitation patterns across the past 150 years aligned with upper graph of estimated global climate.
Source: www.ncei.noaa.gov/pub/data/cmb/ersst/v5/index/ersst.v5.pdo.dat
When the gradual climate trend of increased global temperature, now popularly defined as climate change is factored into the oceanic-driven weather events such as the Pacific Decadal Oscillation (PDO) over this past century, the impacts from warmer-dryer weather cycles become more severe. For the Pacific Northwest and Northern Rocky Mountains, a tremendous forest growth phase initiated by prolonged cool-wet weather from 1945-1985 created a scenario where the transition to a warm-dry PDO weather cycle in the mid 1980s was accentuated by the gradual global warming effect, causing a massive forest species population correction. This was experienced across the entire western United States and Canada as millions of acres of tree-killing insect outbreaks and landscape wildfires. In other words, forests grown dense because of ample water from both the mini-ice age and 40 years of cool-wet PDO have experienced serious dieback. Forest inventory data and historical accounts of forests (and the effects of previous centuries of indigenous-human interactions) from the early to late 1800s represents forests that developed and were growing during the climate of the mini-ice age. The importance of that knowledge is that the forests of the Northern Rockies are no longer under the climatic influence of the mini-ice age, and need to be analyzed with respect to the effects and impacts of the current weather and climate trend.
Forest adaptation
Every climatic fluctuation across the Holocene Epoch from the end of the Pleistocene ice age and the rapid increase in temperatures and the warmer period during the first 5,000 to 7,000 years of the Holocene, to the several “mini-ice ages” over the past 5,000 years ending with the last cold period from 1200 to 1900AD, should have resulted in a selection process for tree species that could survive such changes in climate. These are the species we now have across the Northern Rockies. In addition, this should theoretically (never been measured) have selected for genetically unique “metapopulations” of trees within each species that are scattered across the mountainous terrain of the Northern Rockies. Mountain ranges and prevailing winds can be barriers to pollen and seed dispersal that create isolated populations that experience “genetic drift” resulting in unique local genetics (metapopulations). At the same time, there have been genetic “holdovers” where remnant original populations have survived despite surrounding environmental changes. Certain tree populations found across the northern Rockies have, for example, been referred to as “coastal disjuncts” and identified as surviving unique populations of trees more closely related to populations found along the Pacific coast than surrounding Northern Rockies landscapes. With this knowledge, one would suspect that every “island” mountain range found across Montana might have its own unique genetic metapopulations.
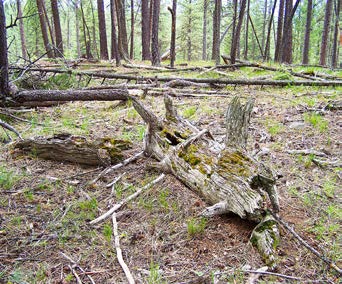
Variability in the selection and preservation of genetic traits within local tree (and plant) species populations is the basis for species adaptations to different climates, soils, and insect and disease resistance nuances across time and landscapes. The unprecedented bark beetle and spruce budworm outbreaks of the past decades across the NW Rockies have presented clear evidence of the resilience of the main tree species found across the region (Image 1). No matter how severe a drought or insect outbreak, a certain percentage of affected forest stands survived, some of which was likely due to unique microsites where trees had better access to soil moisture and potential soil nutrients, and some of which was due to genetic resistance to pests and pathogens. In theory, assisting and promoting trees that survived landscape-level tree-killing calamities could be a method to increase population genetic adaptation to the current warmer and drier conditions. In fact, such assistance might be essential to conserve forested areas that are valuable for human (and nature) interests. Unfortunately, high volumes of tree mortality across landscapes affected by warmer, drier climatic shifts are also very prone to wildfires due to the high fuel loading from fallen and dead trees (Image 2). Should these stands burn without fuel reduction treatments, trees that survived due to their more resilient genetics would also be destroyed, erasing the selection process for potentially better climate-adapted individuals and future populations.
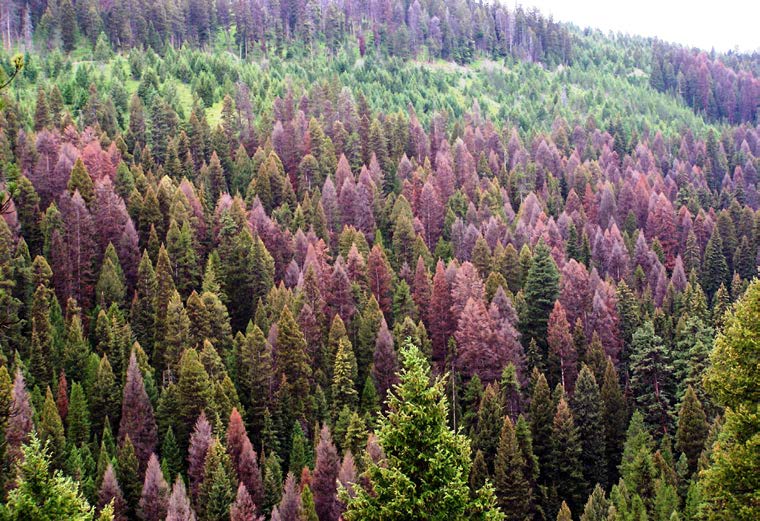 Image 1. A combined Douglas-fir beetle and Spruce budworm outbreak in 2002 across the Bitterroot
showed that tree age classes, species genetics, and site variability in soils and
moisture allowed some Douglas-fir individuals to survive whereas many others perished.
This kind of selection process, often initiated by periodic weather trends, especially
drought and snow breakage creates a selection process for the most fit and adapted
trees.
Image 1. A combined Douglas-fir beetle and Spruce budworm outbreak in 2002 across the Bitterroot
showed that tree age classes, species genetics, and site variability in soils and
moisture allowed some Douglas-fir individuals to survive whereas many others perished.
This kind of selection process, often initiated by periodic weather trends, especially
drought and snow breakage creates a selection process for the most fit and adapted
trees.
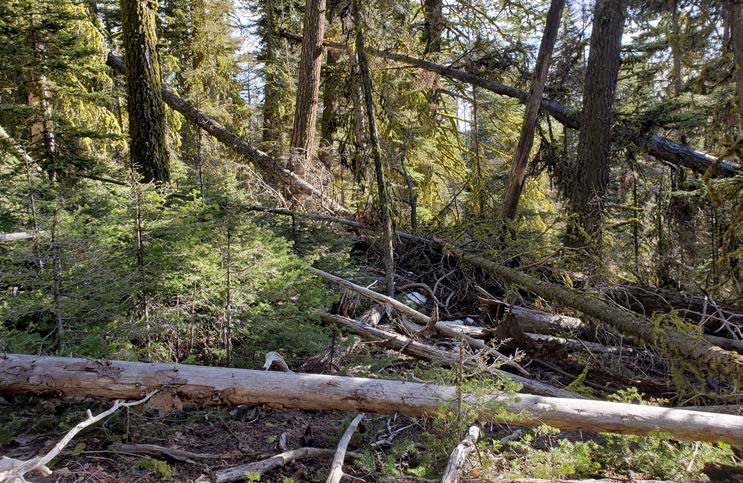 Image 2. The selection process for more genetically fit trees during drought and tree pest
occurrence comes with significant risk. Tree mortality creates copious amounts of
dead wood that during drought is highly flammable. Should a fire occur before decomposition
reduces wood to soil humus, which in the Northern Rockies can take up to 200 plus
years, the selection of more fit trees is negated by severe wildfires that kill the
surviving trees and their seeds.
Image 2. The selection process for more genetically fit trees during drought and tree pest
occurrence comes with significant risk. Tree mortality creates copious amounts of
dead wood that during drought is highly flammable. Should a fire occur before decomposition
reduces wood to soil humus, which in the Northern Rockies can take up to 200 plus
years, the selection of more fit trees is negated by severe wildfires that kill the
surviving trees and their seeds.
The point behind this review of tree evolution over historical climate fluctuations is to examine and develop a perspective of the adaptive ability of Northern Rockies tree species to changes in their environment, especially where weather extremes (drought, heat, wind, sudden temperature changes) will shape the future forests. Some species that are already found across a wide range of ecological conditions, such as Montana’s ponderosa pine, Douglas-fir, lodgepole pine, and spruce species and western larch across wetter forest zones, should have great genetic reserves for adaptability to changes in environmental conditions. This is shown by their continued persistence over the climatic changes of the past 190 million years. Spruce species, for example, have been shown to have 20 billion genetic base pairs and 28,354 genes compared to the human 6.2 billion base pairs and 20-25,000 supported genes. It is not known why the spruce genus has such a large genome, though there is speculation that this is a holdover from having existed in multiple environments for almost 200 million years. Alternatively, other tree species or localized populations may have become so specialized to a specific environment that they lack the ability to adapt to changes in precipitation, humidity, temperature and the associated impacts such as wildfires. Survival of individuals within stands exhibiting mortality from insects, diseases and drought might indicate how much population resilience exists within individual stands.
Some climate scientists suggest that the rate of climate change today may be faster than a species’ ability to adapt through natural selection. Species that already have constrained natural ranges, such as whitebark pine, western red cedar, mountain hemlock and mountain larch might fall into “less-adaptable species” categories. Although efforts are underway to protect identified threatened tree species by helping them reclaim or colonize new suitable habitats, the rapid onset of drought and associated wildfires may severely limit their ability to persist in natural settings. Palaeoecological studies of pollen in lake sediments indicate that some tree species have lived and then died out or migrated into relatively new (within the past 10,000 years) locations across the Northern Rockies.
Temperature, precipitation, and the associated low humidity (also called evaporative demand as low humidity allows dry air to evaporate water out of trees and soil at unsustainable levels) are the three main factors that influence tree seedling survival, tree growth, insect and disease pest vulnerability, and changes in wildfire frequency and severity. So how can forest conservation practices moderate weather and climate changes?
Selection criteria for climate resilient forest stands
Since climate data and predictive models all indicate not only warmer, drier temperatures but also increases in severe weather events, what can be done across landscapes and within forest stands to give them greater resilience? Ideally, every forest stand should be assessed for six critical attributes. These are:
1. Individual crown conditions
Crowns indicate current root health and stability as well as energy reserves and stress resilience. Different age classes of trees vary in their ability to survive or take advantage of different weather events and changes in climate, but productive photosynthetic leaf areas are essential for trees to grow, produce seeds, and persist across the broad environmental gradients of the Northern Rockies. Thus, selecting for quality tree crowns, regardless of tree age, is a good starting point. (see Montana Family Forest News #49, 2022. Tree Crowns, what do they tell us?)
2. Tree species found within each stand
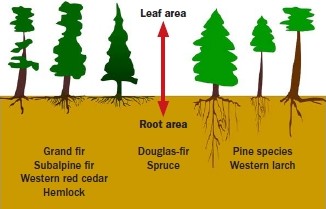
Ponderosa pine, western larch, lodgepole pine, white pine, whitebark pine and limber pine are deep-rooted species and may be better able to withstand drought and higher wind speeds when good soil conditions exist (Image 3, Diagram 7). Grand fir, subalpine fir, spruces, western red cedar, and hemlock are shallow-rooted and more easily impacted by drought or high winds. Douglas-fir is intermediate-rooted and has a high tolerance for drought, as well as has a broad genetic diversity and prolific seed production capacity. These characteristics may give it an edge for survival over many other species, and perhaps why it already has a broad geographic range. As a general concept, the presence of multiple tree species within a discrete forest stand will provide for a greater probability that some species will survive in the event of a pest or pathogen occurrence.
Alternatively, stand invasion by species that are more shade tolerant, less drought tolerant, and more flammable can predispose a stand of trees to severe wildfire effects. A stands’ tree species composition requires a site-specific evaluation that considers the highest risks from known past disturbances and weighs them against future disturbances associated with local predictions for changes in climate such as more frequent storm events and associated wind gusts. Tree species resilience to climate events is an incompletely explored topic within the science of tree physiology and genetics. Most past studies have examined trees for fast growth rates and wood quality more than physiological tolerance to stress, though studies that looked for disease resistance (white pine blister rust for example) have shown that there is significant disease-resistance variability within stands of trees. This adds some merit to the hypothesis that selection for certain individual tree characteristics can increase tree’s resilience to climate-associated stresses.
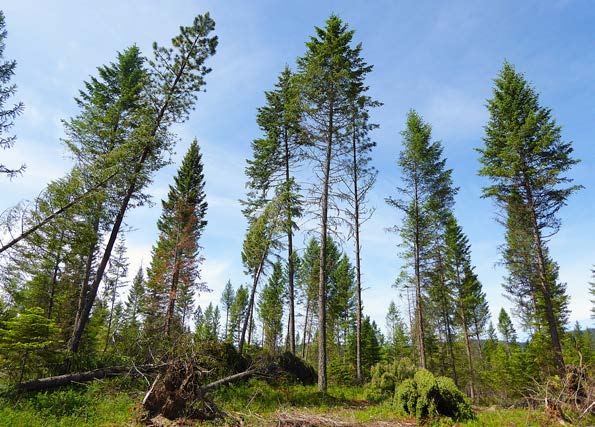
Image 3. Greater potential for storms due to a warming climate may make wind firmness a more important consideration when reducing stand densities for wildfire risk reduction and drought.
| CLIMAX SPECIES Shade tolerant Dense canopy Small, fine buds Thin bark Shallow, fibrous roots Fire intolerant Prone to root disease |
PIONEER SPECIES Shade intolerant Open canopy Thick buds Thick bark Deep, thick roots Fire tolerant Fire-resistant cones |
|
Diagram 7. Basic characteristics of shade-tolerant (climax) tree species |
|
3. Age groupings of each tree species within a stand
Very young trees (5 years or younger seedlings) have shallower root systems and thin bark and can be easily killed by drought or fire events. Alternatively, they show greater tolerance to mechanical damage from harvesting activities, deep snow, floods and windstorms (Image 3). Where deeper soils have good water storage capacity, the lesser leaf area of younger, smaller trees utilizes soil water at a much slower rate, allowing them to stay hydrated longer across the typical summer drought, or exhibit more resistance to the heat from wildfires (Image 4). Sapling and pole-sized trees that have full crowns and are widely spaced can be quite resilient to minor drought events because they do not require as much water for survival as older trees that have reached their maximum leaf area. They are, however, not fire resilient from surface fires when they are drought stressed, as they have thinner bark, and needles that are closer to surface fire heat. Young trees that are approaching maturity (8 inches or more in diameter at their base) start to gain surface fire resilience if they are a thick-barked species such as ponderosa pine and western larch, and sometimes Douglas-fir.
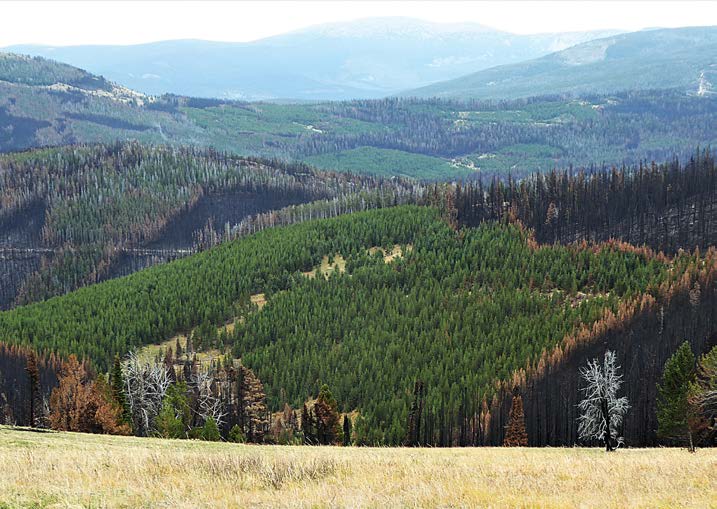
Image 4. Severe landscape fire could not burn into younger tree stands that regenerated from past harvesting. After the fire these previously harvested areas are the only forest stands where multiple tree species and local genetics were conserved.
Overall, shorter trees (younger in most cases) are more wind firm and retain greater flexibility to high winds. As pole-sized trees reach mature status (30-90 years old depending on the site) and have the space to develop or maintain good crowns, they should have good carbohydrate and defense (energy) reserves and may be among the most weather-resilient trees. Old-growth trees that have wide, rounded or flat-topped crowns typically start to deplete soil water reserves earlier in the summer because of their extensive leaf area and high water-loss rates and may exhibit crown dieback (which is why they have rounded or flat-topped crowns). Measuring growth rates (15 rings or fewer per outer radial inch is healthy — more than 30 rings per radial inch is stressed) can be a good indicator of seasonal water availability and overall tree resilience, though this is species specific. Mature ponderosa pine and western larch tend to be quite resilient as older trees if they have good needle retention and crown density. They are often found surviving five or more centuries with greatly reduced growth rates if they can maintain a healthy crown and are not overly crowded by other trees, especially shade-tolerant grand fir or Douglas-fir. Douglas-fir, grand fir, subalpine fir, and lodgepole pine do not typically exhibit great longevity once their growth rates significantly slow as indicated by thin crowns, poor needle retention, and tightly spaced growth rings within their outer layers of sapwood; they may already have root disease issues and a compromised energy reserve, severely limiting their ability to survive drought, high winds or wildfire. Thus, what is often referred to as “old-growth forest” may be resilient, or quite prone to die-off depending on the species and condition of the trees. Unfortunately, many older stands of trees across the Northern Rockies can be found in an overcrowded and fragile state, and are among some of the most prone to sudden death from drought stress or stand-replacing wildfire. The most effective thinning effects that increase stand resilience are for younger trees, pole-sized or mature trees that still have good crowns. Removing dense younger trees from around older trees is a proven method for reducing fire risk to old trees, however, old trees need to be assessed to have good crowns, or else introducing more wind into these stands through neighbor tree removals can result in their decline. Thinning stands of trees with poor crowns too much may introduce more drying wind effects, further stressing the trees, or promoting windthrow in shallow soils or areas where significant root disease has been identified. In such cases, stand removal to promote tree regeneration may be the best option.
4. Know the soils under your trees
Use the NRCS soil mapping application (websoilsurvey.nrcs.usda.gov/
app/). Soil texture and depth are the single most important fixed site variables for estimating
forest stand resilience and for determining the best-adapted tree species for the
site. Deep silt/loam textured soils absorb and store water better than other soil
textures that tree roots can tap into. These soils can support a wider variety of
tree species. In addition, they allow deeper anchor roots to develop that help trees
resist windthrow. Heavy clay textured soils do not allow for good root penetration
or extensive root systems for water acquisition. Sandy or gravelly soils allow for
deep root systems to develop, especially tap-rooted tree species such as pines and
larch, but have poor water holding capacities. Unless sub-irrigated (shallow water
table), they are prone to drought stress. Poor nutrient availability in sandy or gravelly
soils also predisposes most trees (except ponderosa pine) to nutrient deficiencies,
root disease and insect pests. Shallow soils overlaying bedrock or a high water table
are a high risk for taller, mature trees as they lack water reserves, anchoring stability,
nutrient availability and are prone to getting too warm and drying out if they are
facing the sun. Thinning stands to overly-wide spacings (20 feet or more between trees)
on such soils can be counter-productive, resulting in catastrophic wind blow-over.
5. Insect and disease risk within a stand of trees
Pests and pathogens tend to be species-specific, and if a stand of trees is comprised of mainly one species that is already showing indications of a specific bark beetle, defoliators, or root disease, it may be worthwhile to reduce the density of the most susceptible tree species and promote greater tree species diversity. All trees will experience some damage from insects and diseases, but healthy trees can grow back damaged needles or roots relatively quickly. It can be assumed that almost every tree has some root disease fungus present, however, stressed trees will be unable to grow back new roots, which is indicated by a thinning crown or crown top dieback. A steady decline in roots means the tree is unable to meet its soil water and nutrient needs, further slowing photosynthesis and the ability to grow back damaged roots and branches. This creates a slow death spiral that can take several years — root dieback creates less ability to produce energy, which allows more root dieback, which creates less ability to collect soil water and support new tree needles, etc. Grand fir is a species that is most susceptible to a variety of insects (fir engraver beetle, spruce budworm, tussock moth) and diseases (Indian paint fungus, Armillaria root disease) and is not a long-lived species for most of Montana. It is shallow-rooted and prone to drought stress, and thin-barked, which makes it highly susceptible to fire damage.
Lodgepole pine is a species that is promoted by stand-replacing wildfires, that as it gets older is extremely susceptible to mountain pine beetle. Monocultures of lodgepole pine typically fall victim to bark beetles and wildfires when they reach 100-200 years in age, and as a result, lodgepole pine is considered a short-lived species. Alternatively, when lodgepole pine grows as an individual or in a small clump within a mixture of Douglas-fir, western larch, ponderosa pine, grand fir, spruce and even western red cedar, it can live well over 300 years, with records of this species exceeding three feet in diameter. Because of its fire-resistant closed cones and early maturity for producing viable seeds (10 years), lodgepole pine may be favored by climate change-related increases in wildfires and is a valuable species to retain in a mixed species stand.
6. Ensuring that resilient trees can reproduce
Natural selection for fitness follows the principle that the most adapted trees (vigorous, structurally sound, genetically diverse) survive and reproduce (Image 1). Wildfire, however, is an agent that does not help natural selection unless it is for fire-adapted traits such as thick bark, fire-resistant cones, less flammable needles, and deeper rooting habits. High fuel buildup from stress events such as drought, insects, disease, and windthrow create conditions for severe fires that can kill all surviving trees (Images 2 and 4), eliminating the potential for more fit trees to pass their genetics onto the landscape and provide for better climate-adapted tree populations. Stressors other than fire are helping select the best genetics that show resilience to the current warming trend. Helping those individuals survive and reproduce by removing or reducing fuels around them should help speed up selection for future climate-adapted trees.
Forests for carbon sequestration
Forests have played an ever-increasing role in the climate change discussion because of their potential ability to absorb human-created greenhouse gases. Forests are a significant mechanism for carbon sequestration where trees absorb atmospheric carbon dioxide through photosynthesis and store it as lignin and cellulose within their wood (Diagram 8). Forests can also be significant sources of atmospheric CO2 and methane when trees die, are heat-stressed, or burn in wildfires. At around 96 F, cell respiration exceeds photosynthesis, and native live trees of the Northern Rockies become net producers of atmospheric CO2. The same occurs when trees are drought-stressed and have to stop gas exchange with the surrounding air to prevent dry air from sucking water out of the leaves and needles. Unfortunately, the hottest months of July, August and September across the Northern Rockies also become increasingly dry. The higher leaf area of a mature, dense forest tends to lose water at an unsustainable rate, depleting available soil water earlier in the summer than younger forests and less dense forests, each of which may have only half the leaf area as a mature, older forest. When trees run out of water, they must stop or slow photosynthesis, which means they cannot grow and sequester carbon dioxide from the air. What compounds this process is that trees, like all living things, need to respire to stay alive, using stored carbohydrates. What is called “maintenance respiration” is the cellular process of staying alive by burning stored sugar (or in the case of humans – consuming carbohydrates). For plants, the rate of respiration is determined by temperature — the higher the temperature, the faster the respiration. Thus, when forests are most likely drought-stressed during summer heat, they are also respiring and producing gaseous CO2 at the greatest rate. A hot, drought-stressed forest becomes a net producer of atmospheric CO2, whereas a hydrated hot forest is still a net sequestration mechanism of atmospheric CO2.
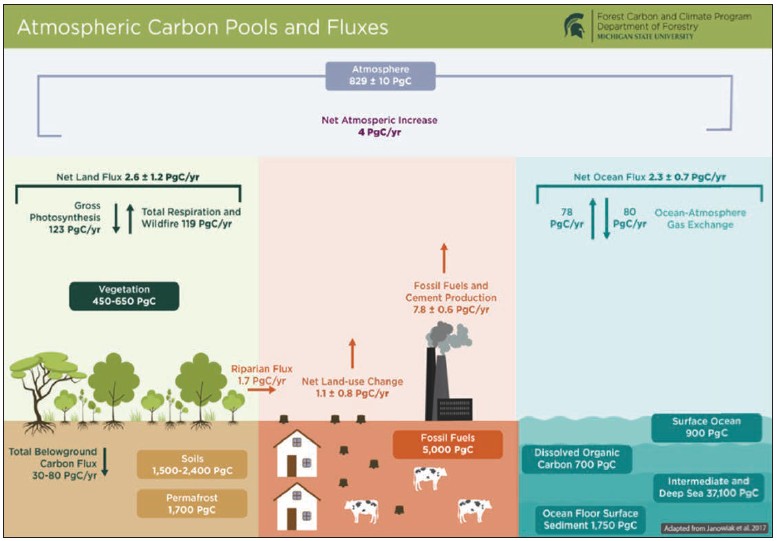
Diagram 8. Basic carbon cycle diagram showing how proportions of atmospheric carbon are cycled and sequestered. It is estimated that 11 percent of annually human-emitted CO2 is sequestered by forests.
Tree growth rates, longevity, persistence of dead woody debris, and forest contributions to soil carbon vary tremendously among tropical, temperate, grassland and boreal forest ecosystems (Diagram 9). The forests of Montana are in a transition zone between temperate and boreal ecosystems, with mid-to-lower elevations considered temperate due to their moderate annual temperature and precipitation patterns, whereas higher-elevation forests take on more of a boreal (cold and sometimes wet) characteristic. Grasslands remain a mostly underestimated carbon storage mechanism because their largest carbon pool (soil) is not visually obvious. Forest ecologists have not studied the below-ground carbon pool as extensively as above-ground carbon in woody stems because it is hard to measure, monitor and is less understood. Soil carbon, however, offers greater stability for carbon sequestration and has been defined as both “slow carbon” and “fast carbon” based on how quickly the organic carbon pools can change with a change in environment. Forest tree harvesting adds complications to the overall carbon sequestration models by affecting both above-ground carbon storage and sequestration, as well as impacting below-ground carbon sequestration and storage.
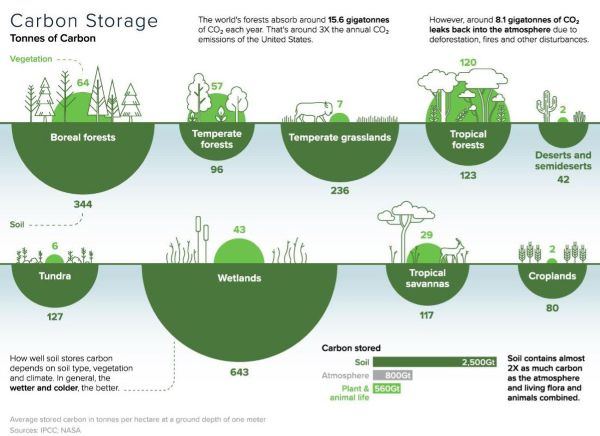
Diagram 9. Measured carbon storage across different forest types. The largest pool of stored carbon is found in the soil across forests of the Northern Rockies. Decomposition of soil carbon slows in cooler soils, which is why boreal forests and oxygen-deprived soils in wetlands store the most carbon. Most soil carbon deposition is the result of forb, grass, shrub and tree roots growing and dying.
The effects of harvesting trees remain more controversial in social circles than across the scientific literature. Anti-forest-harvesting advocates make the argument that harvesting big, old trees produces a net release of sequestered carbon into the atmosphere that will take centuries to be reabsorbed into a younger forest that grows back. Thus, harvesting old trees results in a net increase in atmospheric CO2 for a century or more. However, forests comprised of old trees may also be more susceptible to pests and pathogens depending on the tree species and geographic location. The timber harvesting side of the argument makes the case that harvested trees that are converted into wood for construction puts a certain percentage (from 5-30 percent depending on how wood is utilized) of sequestered CO2 into longer-term storage in the form of building construction, than a forest of old trees could sustainably maintain, and thus increases the net overall storage of atmospheric carbon. In addition, replanted or regenerated forests comprised of younger trees have a higher rate of sequestering carbon than older trees and may be more resilient to wildfires. Recent studies of carbon sequestration by forests indicate that Northern Rockies forests have, for the past decades, actually contributed more CO2 to the atmosphere than they absorbed due to forest mortality from insects, disease and wildfires.
Both sides of the forest carbon sequestration argument make valid points, though an important difference that is often not mentioned is the time frame used for greenhouse production and generation calculation. Many old-forest protection advocates consider the next 30-50 years pivotal, as some climate models indicate that current rates of greenhouse gas emissions will result in irreversible bio-geo-chemical shifts in our atmosphere and biological processes during this time that will push the Earth’s ecology past a point of return.
According to these models, greenhouse gas emissions and atmospheric greenhouse gases need to be reduced within the next 30 years, and longer-term processes, such as the 200 years needed to regrow old forests, will take too long. Alternatively, forest management advocates argue that using more wood construction versus metal and concrete construction could make up this CO2 emission deficit. Interestingly, many proponents of greenhouse gas theory, such as universities and larger urban areas, tend to still preferentially use steel and concrete construction that has a much higher CO2 footprint. Depending on log conversion technologies, the wood contained in a forest of large, old trees may result in 20-40 percent sequestration in wooden beams for construction that may last 30-100 years. In Europe, houses are expected to remain functional for 100-plus years and in many situations, much longer. For example, the beams in many castles and old-town home construction are 800-plus years old, and most modern houses built in climate-conscious Europe are expected to last a century or more, which is about double the expectations of construction built in the United States. Thus, improvements in how wood is used and its lifespan in construction applications need to be addressed.
Climate smart forestry
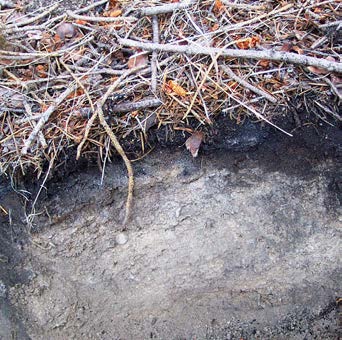
Forests store carbon both above-ground as wood and plant residue, and below-ground from the growth and death of root systems. The conifer forests of the Northern Rockies do not support earthworms that pull vast amounts of organic matter into the soil and help create the thick organic soils found in the prairies and broadleaf forests of the Midwest and Eastern United States (Image 5). The mechanism of root turnover and carbon deposition into the soil is most pronounced under grass, forb and brush plant communities. Soils found under dense conifer forests typically only absorb carbon as highly decomposed elemental molecules that can leach into the soil with rain or snowmelt, or from tree root turnover that tends to be very slow, and from fungal soil organisms that form mutualistic or antagonistic relationships with tree roots.
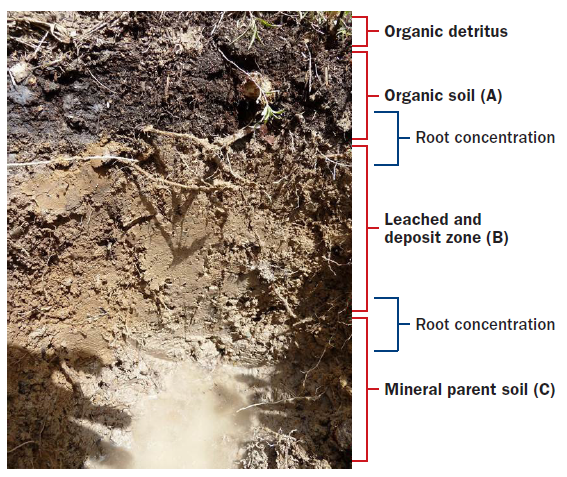
Image 5. The typical soil profile of a conifer forest of the Northern Rockies. The highest concentration of organic carbon in soils resides in the surface A horizon where fine roots grow. The most carbon-depleted soils are in the B horizon where organic acids from vegetation decomposition leach nutrients and carbon into the deeper C horizon.
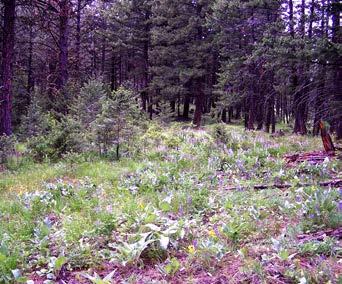
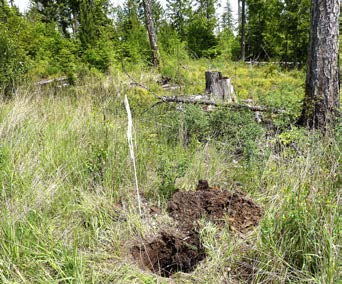
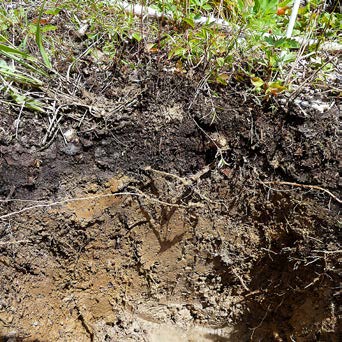
Fungal pathogens and decomposers feed on tree roots, whereas mutualistic mycorrhizae trade soil nutrients to root systems for carbohydrates. Northern Rockies Forest ecosystems are complex plant and animal communities that cycle across different soil types over hundreds to thousands of years. When trees die due to a climate shift or disturbance such as wildfire or insect outbreak, they are often replaced for some period of time by grasses, forbs and shrubs. In many instances, this process, known as “succession,” can last for 50 to 300 or more years on any particular site. During this vegetative phase across the landscape, the thriving grass/forb/shrub community deposits increased amounts of carbon in the soil (Image 6, Diagram 10). Tree-generated woody debris on the soil surface can take tens to hundreds of years to decompose and is the process that creates a “humus” layer on the soil surface. Wood itself breaks down very slowly because it is not very nutritious for arthropods or microbes. A study of 20-inch diameter Douglas-fir logs showed that on an average NW forested site, it took 80 years for half of the log to decay. Other studies have shown that on average, microbes need a nitrogen to carbon ratio of 1 to 20 to be able to digest woody tissue, and the average ratio in a mature tree stem is about 1 to 400.
| A | B | C |
|---|---|---|
 |
 |
 |
 |
 |
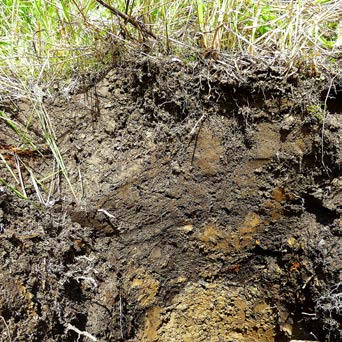 |
| Image 6. Although soil development is considered a slow process that can take hundreds to thousands of years, a change in plant species and density can dramatically increase soil organic matter. Most Northern Rockies soils are considered relatively thin and young with little soil development from mineral weathering or organic matter. These young soils are called “entisols.” The invasion of forbs, grasses and shrubs after the removal of some or all of the tree overstory that results in more available light and water to the soil surface can result in a relatively quick increase in soil carbon deposition. This time sequence of soils under: (A) dense intact forest, (B) a 10-20-year-old opening in a forest, and (C) a 30-year-old harvested forest, shows how quickly a thicker organic upper soil horizon can develop. Studies regarding overall forest carbon storage in temperate to dry forests have shown that thinning trees, that allowed for a denser forest understory to develop, resulted in greater soil carbon storage than the original intact, dense forest. These kinds of results will vary by forest ecosystem type. | ||
Surface wood in forests across the Northern Rockies is therefore very slow to decay and typically burns in a wildfire before the decomposition process is complete. For this reason, woody debris accumulation in forests may not be a good long-term carbon sequestration mechanism. Carbon deposited in the soil by fine root turnover is usually much longer persisting. Soil temperature, moisture and oxygen usually determine soil carbon longevity. This is why warm, moist soils of a temperate forest do not store carbon as long as the colder soils of boreal forests. Quantifying where soil carbon storage makes sense across different forest ecosystems remains a challenge.
| A | B |
|---|---|
 |
 |
|
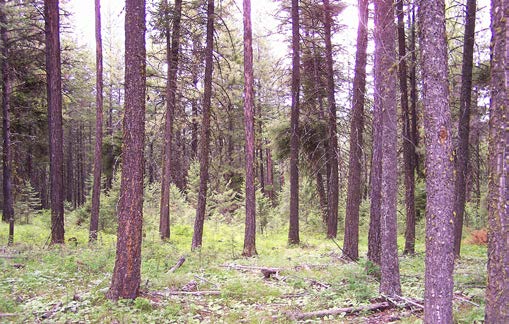
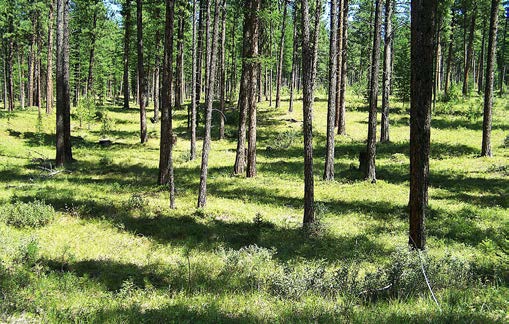
Image 7. A more dense or natural forest (A) may have more carbon stored in tree stems, but it also often has a poor understory vegetation component and less soil carbon storage. Alternatively, a thinned forest (B) can result in increased growth rates of residual trees, allowing them to get bigger and sequester more carbon at a faster rate. Second, it allows understory vegetation to establish and increase soil carbon storage through fine root turnover. Third, it increases the deposition of rain and snow into the soil and helps trees survive pests, drought and wildfires. |
|
Some of the tradeoffs among forest ecosystem processes are not understood well enough to assign accurate carbon storage values to all forest types. The rate of understory vegetation development following forest density treatments (Image 7) and the associated rate of fine root soil carbon deposition will vary tremendously among the hundreds of different forest tree and understory plant associations (Images 8 and 9). Likewise, the effects of increasing gap size between trees to increase rain and snow accumulation on the soil surface will vary greatly between southern-facing slopes and northern-facing slopes. Although numerous independent studies have shown significant increases in the snowpack (Diagram 11, Image 10) and watershed yields as a result of tree thinning or the creation of canopy gaps, modeling and calculating impacts for specific watersheds remains elusive. Research regarding tradeoffs among forest treatments, resilience, growth, and overall carbon accumulation and ecosystem function is needed. The overall basis for climate-smart forestry is to try and assist forested landscapes adapt to changes in climate by providing for genetic selection for populations of trees that can grow well within new climatic patterns, while also reducing atmospheric CO2 and leaving a forest that still provides all or most ecosystem services that humans deem important.
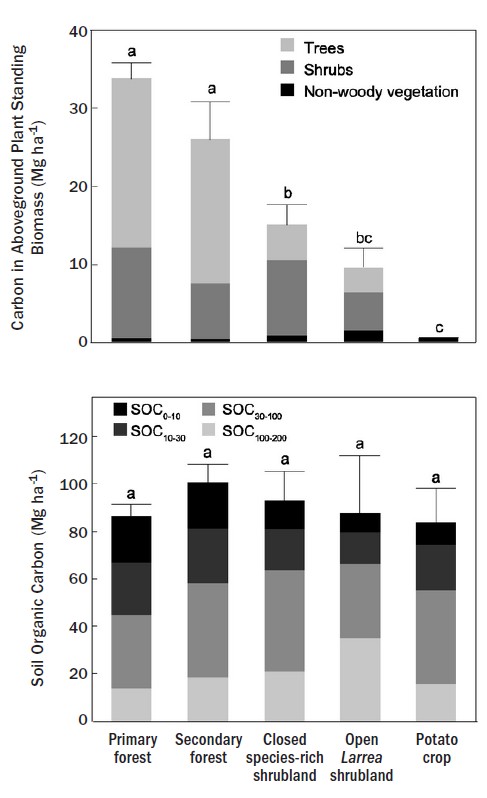
Diagram 10. Forest carbon is stored in adjacent undisturbed forest, thinned forest, brushland and agricultural sites in subtropical southern South America. Thinning increased the amount of soil carbon (SOC) at varying depths, that is more climate stable compared to aboveground woody carbon in the unthinned forest.
Assisting forests through appropriate management practices in the right locations will be critical if the conservation of the current expanses of forests is a priority. Unfortunately for federal public lands, the discussion often remains a question of “if” we should manage, rather than moving to the questions of “how” we should manage. Private forest landowners tend to be proactive in experimenting with forest treatments. Unfortunately, their management impacts are constrained by the size of land ownership, and occasional lack of collaboration and coordination across watersheds and ecosystems.
| A | B |
|---|---|
 |
 |
|
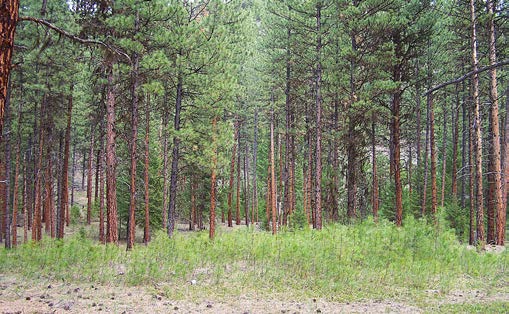
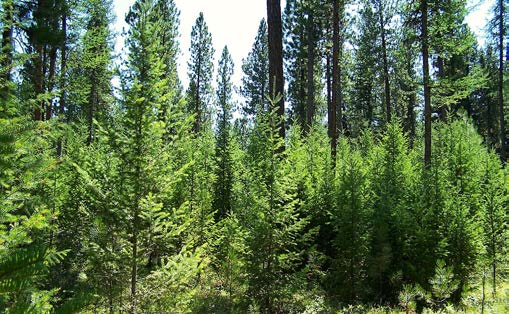
Image 8. Creating openings (A) in dense forests allows more light and water that promotes understory plants in more of a patchy mosaic. Reducing overstory tree density by thinning or creating openings can also promote dense forest tree seedling regeneration (B), especially when soils are disturbed during harvesting. Reducing the density of such regeneration can be a costly endeavor, but is important if the goal is to keep such younger trees growing well. Alternatively, some patches might be left for wildlife cover. Dense tree regeneration suppresses understory forbs and grasses which can be important for developing more carbon-rich soils. |
|
| A | B |
|---|---|
 |
 |
|
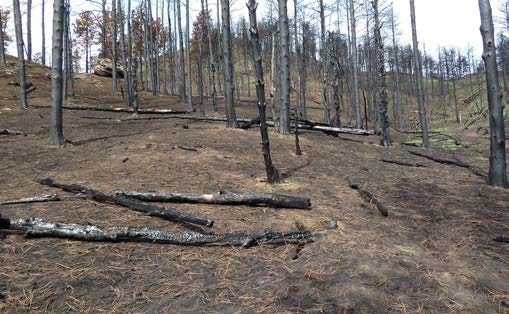
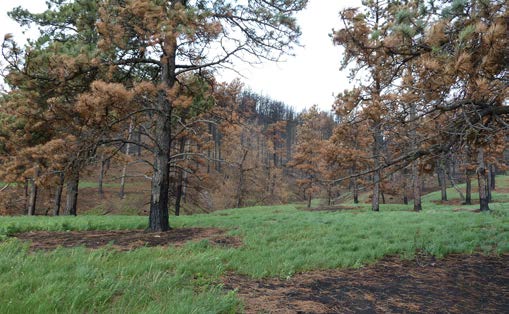
Image 9. A final benefit of reducing forest tree density is that widely spaced trees reduce the risk of severe crown fires (A). In addition, a healthy plant community that develops in thinned forests is quick to resprout after a ire (B). These pictures are in the same stand that experienced a wildfire. Images A and B are 50 yards apart and were taken in late summer following a light rain that stimulated grasses and forbs to sprout. Thick pine needle duff in the dense forest and under trees suppressed grass and forb growth. |
|
|
Diagram 11. Every forest varies tremendously based on the physical and biological relationships that occur. Local microclimates interact with basic soil geology to support different tree species and understory plant communities. Across the Northern Rockies, there are 10-30 different understory plant communities comprised of species that are associated with each of the major forest overstory species. These have been classified as “Habitat Types” for each climatic region within this larger ecosystem. Each tree-plant association will have different subtle impacts and feedback with soils, creating different effects and quantities of carbon sequestration into soils. However, the principles of creating gaps in forest overstories remain the same across such a complex matrix of forest types, understory plants, and soil textures as is illustrated. Forest gaps, either as more uniform thinning, or discrete openings, increase the diversity of plant and animal species within a forest, which can reduce the magnitude of forest disturbance. Diagrams: Peter Kolb |
THINNING EFFECTS Thinning simultaneously decreases water loss through leaf transpiration and increases rain and snow penetration to the soil surface. Excessive thinning may allow for greater sun and wind penetration into tree canopy reducing the magnitude of the first two effects.
Root systems of harvested trees decay, increasing the nutrient and water holding capacity of the soil. Alternatively, extensive harvesting of the same tree species as the “leave” trees has the potential for creating a growing base for root pathogens that may infect remaining live trees. |
|
PATCH CUT EFFECTS
Tree canopy openings have the potential of acting as snow and rain collectors. Alternatively, openings on southern aspects may act as solar radiation collectors, creating a warmer, drier microclimate. Old decaying stumps become nutrient/water reservoirs. |
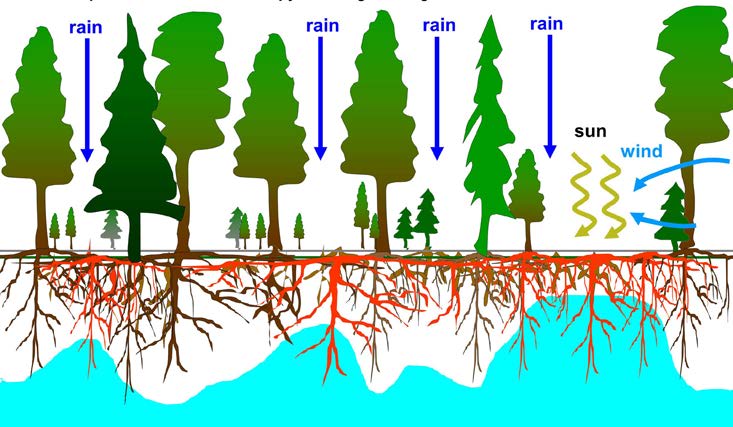
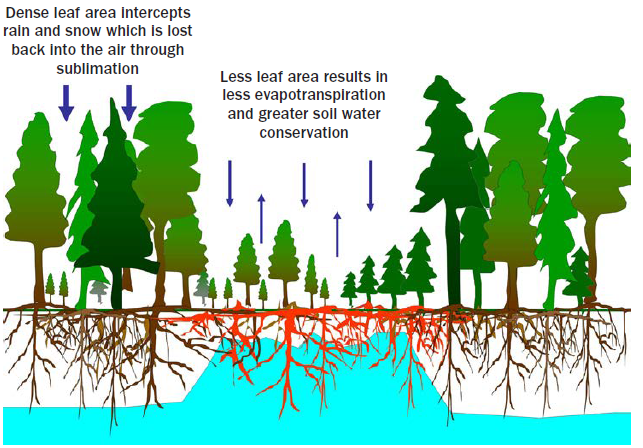
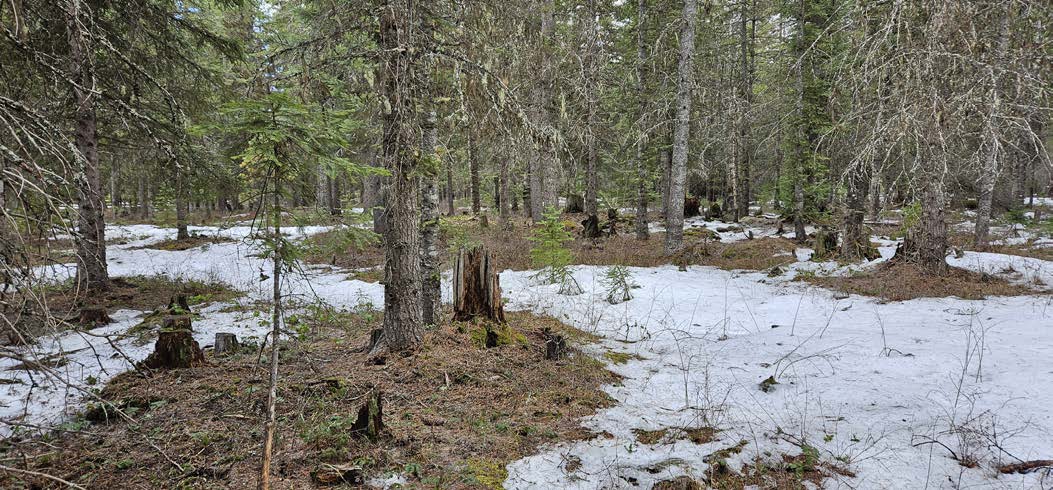
Image 10. A more open forest canopy created by thinning or group selections allows more rain and snow to reach the forest floor, helping recharge soil water reserves. A closed canopy forest will catch up to 50 percent of snow and rain in the canopy that evaporates back into the atmosphere.
Carbon markets
The role of forests with respect to climate change is complex because one has to consider the topic of forest carbon as well as forest ecosystem function. Forests provide many benefits, and managing for some specific objectives may be to the detriment of others. Some markets have arisen where forest carbon is “bought” by entities wanting to use forests as sinks to offset their industrial, manufacturing or land-use CO2 emissions. So far, these arrangements have only materialized for larger acreage (1000 acre-plus) landowners. The California carbon market is one such entity that is actively using an investment approach for securing carbon “sinks” by paying landowners to ensure a certain volume of trees (wood) and growth (carbon sequestration) will occur on specified land areas for some specific period of time - usually the next 100 years. For some landowners this is a significant financial incentive to place a conservation easement on their property that requires that most trees will never be harvested for the duration of the contract. A concern for this approach is that forests are complex ecosystems that have biological and physical processes always at work that are not entirely controllable or predictable. Weather and climate are always changing, and with that, ecosystem functions also change due to wildfires, insects and diseases, tree growth, understory plant communities, wildlife, soil biota, and carbon cycles.
If carbon sequestration for a forest is to be quantified and markets developed for the purpose of climate stability or offsetting the impacts of greenhouse gases, it might be better to invest carbon offset money into entire functioning ecosystems that contain all of the diverse carbon cycles that help define an ecosystem. This should include the effects of different vegetation types associated with natural successional cycles that forests experience across different topographic features, soil types, historical and natural disturbance processes, management plans that could include the harvesting of trees for forest maintenance and wood fiber production, and different wildlife habitat needs and watershed cycles. Net carbon sequestration or CO2 emissions are both natural processes across entire ecosystems. For example, all the landowners within a watershed could have an ecosystem carbon cycle plan with prorated payments, or indigenous tribes with landscape forest management plans could have such a plan for their entire tribal land base. The notion of selling the carbon rights to a specific stand of trees or defined large-forested acreage without considering the dynamic and complex interactions across an entire landscape, watershed or even mountain range is somewhat analogous to embarking on a treatment for a headache without considering the treatment effects on the rest of the body. Carbon credits should be considered for an entire forested and functionally-resilient ecosystem, where management actions such as forest harvesting and thinning are part of the processes that keep the entire ecosystem’s carbon cycle functional and resilient.
Sources and additional reading
Alvarez, M. 2007. The State of America’s Forests. Bethesda, MD: Society of American Foresters. 68 pgs.
Biondi, Franco; Gershunov, Alexander; Cayan, Daniel R. 2001. North Pacific Decadal Climate Variability since 1661. Journal of Climate 14 (1): 5–10.
Conti, G., Perez-Harguindeguy, N., Quetier, F., Gorne, L.D., Jaureguiberry, P., Bertone, G., Enrico, L., Cuchietti, A., and Diaz, S. 2014. Large changes in carbon storage under different land-use regimes in subtropical seasonally dry forests of southern South America. Agriculture, Ecosystems and Environment 197 (68-76).
European Forest Institute. 2009. Climate change and other a(biotic) disturbances.
www.eft.int/research/themes/climate_change_and_other_
a_biotic_disturbances.htm
FAO. 2009. Climate change and the forest sector. www.fao.org/docrep/
007/y5647e/y5647e05.htm
Gannon A., and S. Sontag. Compilers. 2009. MONTANA Forest Insect and Disease Conditions and Program Highlights – 2009. Report 10-1 USDA Forest Service, Northern Region, State and Private Forestry, Forest Health Protection. 51 pgs.
Herms, D.A. and W. J. Mattson. 1992. The Dilemma of Plants: To Grow or Defend Author(s): Source: The Quarterly Review of Biology, (67) 3, pp. 283-335.
Hubbart, Jason A., Link, Timothy E., Gravelle, John A., and Elliot, William J. 2007. Timber Harvest Impacts on Water Yield in the Continental/Maritime Hydroclimatic Region of the United States. Forest Science 53(2). 2007. pp.169-180.
Immler, T. 2004. Waldbauliche Pflegestandards zu den Fortbildungsveranstaltungen. Landesanstalt für Wald und Forst. Freising Bayern. 19 pgs.
Janisch J. E. and M. E. Harmon. 2002 Successional changes in live and dead wood carbon stores: implications for net ecosystem productivity. Tree Physiology 22. 77-89.
Joyce, J. A., Bentrup, G., Cheng, A. S., Kolb, P., Schoeneberger, M., Derner, J. 2017. Native and agricultural forests at risk to a changing climate in the Northern Plains. Climate Change. DOI 10.1007/s10584-017-2070-5.
Jouzel, J., Lorius, C., Petit, J. R., Genthon, C., Barkov, N. I., Kotlyakov, V. M., and Petrov, V. M. 1987. Vostok ice core: a continuous isotope temperature record over the last climatic cycle (160,000 years). Nature 329, 403-408.
Keane, Robert E.; Agee, James K.; Fule, Peter; Keeley, Jon E.; Key, Carl; Kitchen, Stanley G.; Miller, Richard; Schulte, Lisa A. 2008. Ecological effects of large fires on US landscapes: benefit or catastrophe? International Journal of Wildland Fire. 17: 696-712.
Leppi, J.C., DeLuca, T. H., Harrar, S. W. and S. W. Running. 2011. Impacts of climate change on August stream discharge ion the Central-Rocky Mountains. Climatic Change DOI 10.1007/s10584-011-0235-1.
Meyer, L. Compiler 2005. Montana Forest Insect and Disease Conditions and Program Highlights – 2004. Report 05-1 USDA Forest Service, Northern Region, State and Private Forestry, Forest Health Protection. 50 pgs.
MacDonald, G. M. 1989. PostGlacial Palaeoecology of the subalpine forest – grassland ecotone of southwestern Alberta: New insights on vegetation and climate change in the Canadian Rocky Mountains and adjacent foothills. Palaeogeography, Palaeoclimatology, Palaeoecology, 73. 1989:155-173. Elsevier Science Publishers.
McCauley, L. A., M. D. Robles, T. Woolley, R. M. Marshall, A.Kretchun, and D. F. Gori. 2019. Large-scale forest restoration stabilizes carbon under climate change in Southwest United States. Ecological Applications 00(00):e01979. 10.1002/eap.1979.
Mumma, S. A., Whitlock, C. Pierce, K. 2012. A 28,000 year history of vegetation and climate from lower Red Rock Lake, Centennial Valley, Southwestern Montana USA. Palaeogeography, Palaeoclimatology, Palaeoecology 326-328. 2012: 30-41. Elsevier Science Publishers.
Müller-Stark, G. M. Ziehe, and R. Schubert. 2005. Genetic diversity parameters associated with viability selection, reproductive efficiency, and growth in forest tree species. Springer-Verlag Berlin. Ecological Studies, Vol 176, 87-108.
Pfister R. D, B. L Kovalchick, S. F. Arno, and R. C. Presby. 1977. Forest habitat types of Montana. USDA Forest Service GTR INT-34. 174 pgs.
Power, M. J., C. Whitlock, and P. J. Bartlein. 2011. Postglacial fire, vegetation, and climate history across an elevational gradient in the northern Rocky Mountains, USA and Canada. Quaternary Science Reviews (30) 2520-2533.
Rigolot, E., Fernandes, P., and F. Rego. 2009. Managing wildfire risk: prevention, suppression. European Forest Institute, Discussion Paper 15. In: Living with Wildfires: What science can tell us, Yves Birot (ed.) 49-52.
Running, S. 2008. Ecosystem Disturbance, Carbon, and Climate. Science 11, 652-653.
Running, S. 2006. Is global warming causing more larger wildfires? Science 313, 927-928.
Shen, Caiming; Wei-Chyung Wang; Wei Gong; Zhixin Hao. 2006. “A Pacific Decadal Oscillation record since 1470 AD reconstructed from proxy data of summer rainfall over eastern China.” Geophys. Res. Lett. 33 (3).
Schmid, J. M, S. A. Mata, R. R. Kessler, and J. B. Popp. 2007. The influence of partial cutting on mountain pine beetle-caused tree mortality in Black Hills ponderosa pine stands. USDA Forest Service Rocky Mountain Research Station, RMRS-RP-68. 19 pgs.
Waring R. and S. Running. 1998. Forest Ecosystems Analysis at multiple scales. Academic Press, San Diego, CA. 370 pgs.
Wegener, G., and B. Zimmer. 2000. Wald und holz als kohlenstoffspeicher und energietrager. Chancen und wege fur die forst und holzwirtschaft. In: Schulte A. et al (ed) Weltforstwirtschaft nach Kyoto: Wald und holz als kohlenstoffspeicher und regenerativer energietrager: Aachen Shaker V1g. ISBN 3-8265-8641-7, 113-122.
Whitlock, C., Briles, C. E., Fernandez, M. C., Gage, J. 2011. Holocene vegetation, fire and climate history of the Sawtooth Range, central Idaho, USA. Quaternary Research 75. 2011: 114-124. Elsevier Science Publishers.
Yude, Birdsey, R. A., Phillips, O. L., Houghton, R. A., Fang, J., Kauppi, P. E., Heather, K., Kurz, W. A., Ito, A., Lewis, S. L., Nabuurs, G.J., Shvidenko, A., Hashimoto, S., Lerink, B., Schepaschenko, D., Castanho, A., Murdyarso, D. 2024. The enduring world forest carbon sink. Nature, Vol. 631, 563-569.